2023
Summaries of our end of Key Stage results for 2023 are shown below. We continue to be proud of the results our children are able to achieve through their continued hard work and talent.
Early Years Foundation Stage (EYFS):
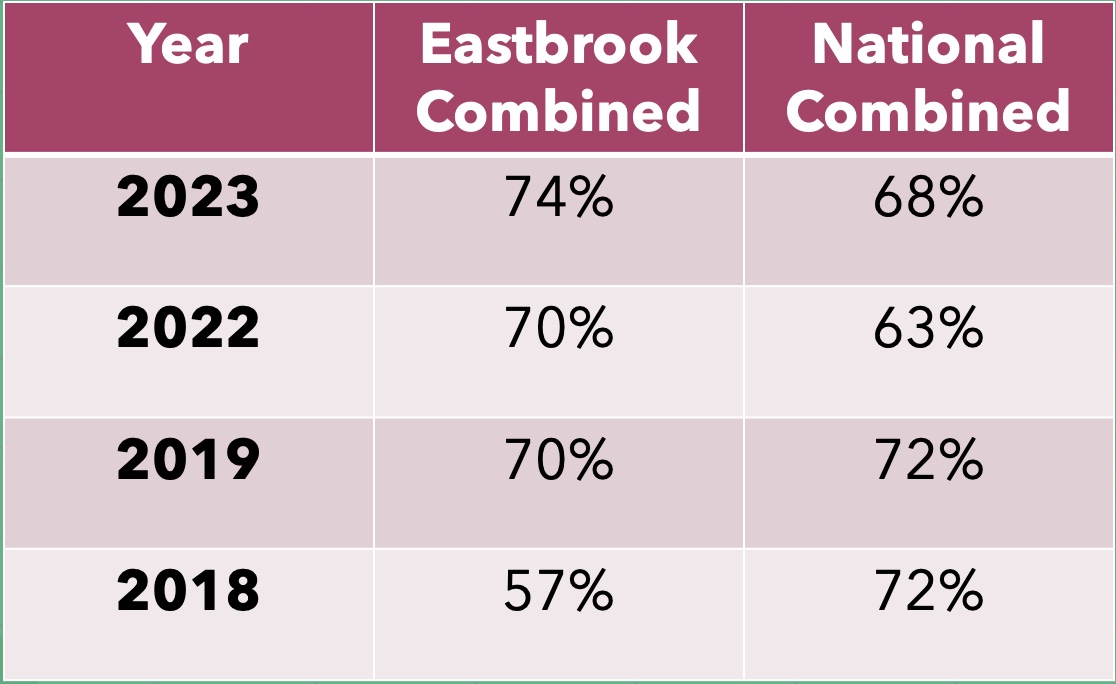
The table below shows the trends in our EYFS data since 2019. The ‘combined’ score shows the % of pupils achieving a Good Level Of Development (GLD) – the expected standard.
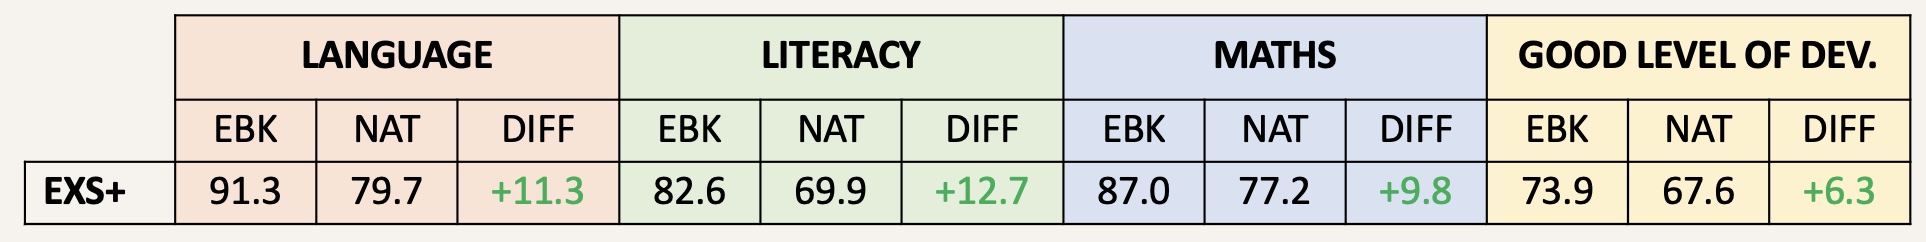
The table below shows a breakdown of our EYFS data by specific learning areas for 2023. EXS+ shows the % of pupils achieving at, or above the expected standard for Reception pupils.
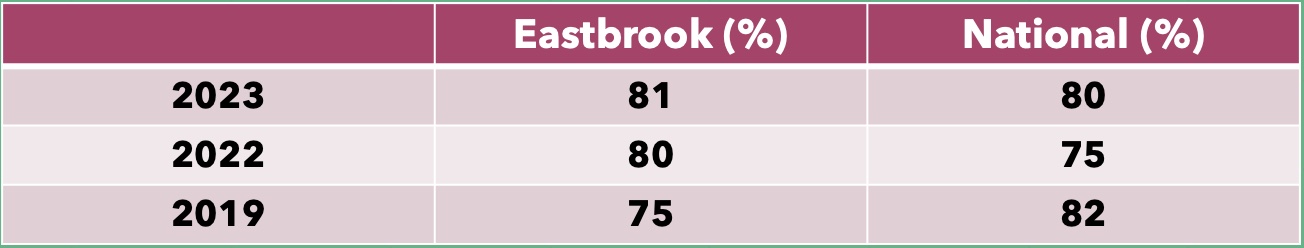
Key Stage One Phonics Screening Check:
% of pupils attaining the expected standard. Figures in brackets indicate the national average figures.
End of Key Stage One (Year 2 SATs):
% of pupils attaining the expected standard and greater depth standard. Figures in brackets indicate the national average figures.
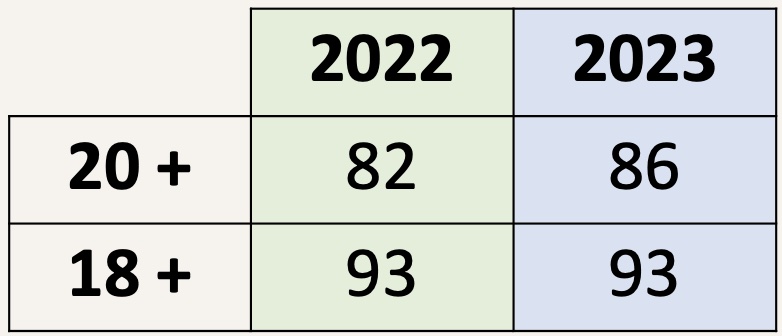
Year 4 Multiplication Tables Check:
% of pupils scoring 18 + and 20 +. This represents the second set of this data collected by the school. The test is out of a total of 25 marks.
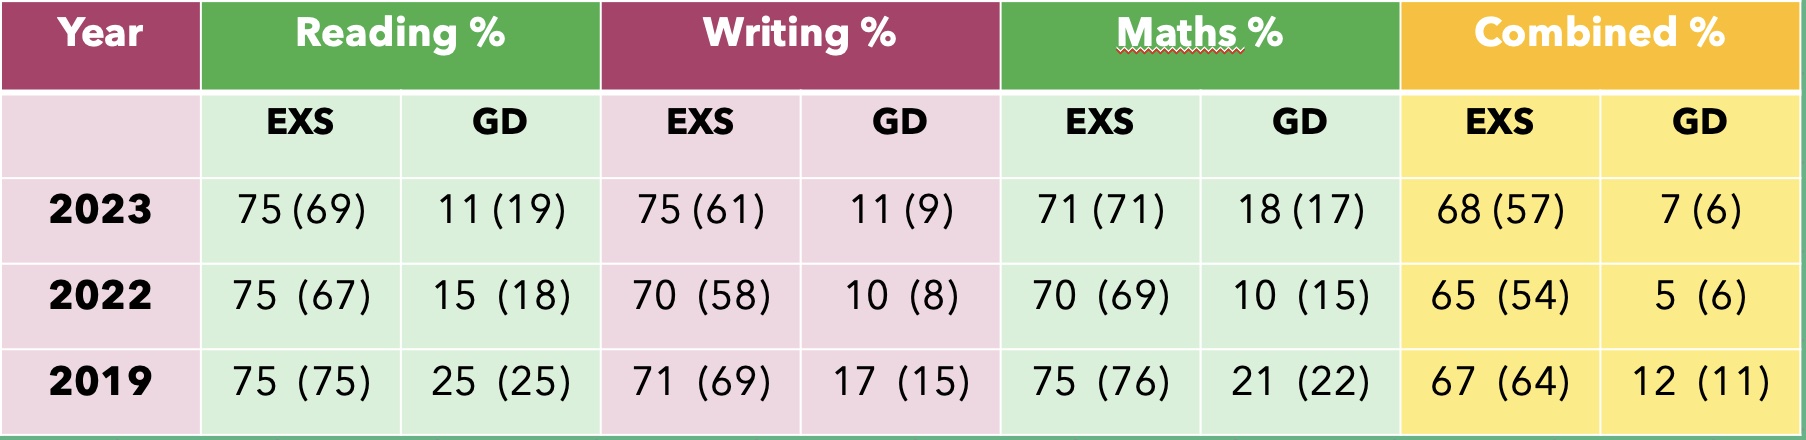
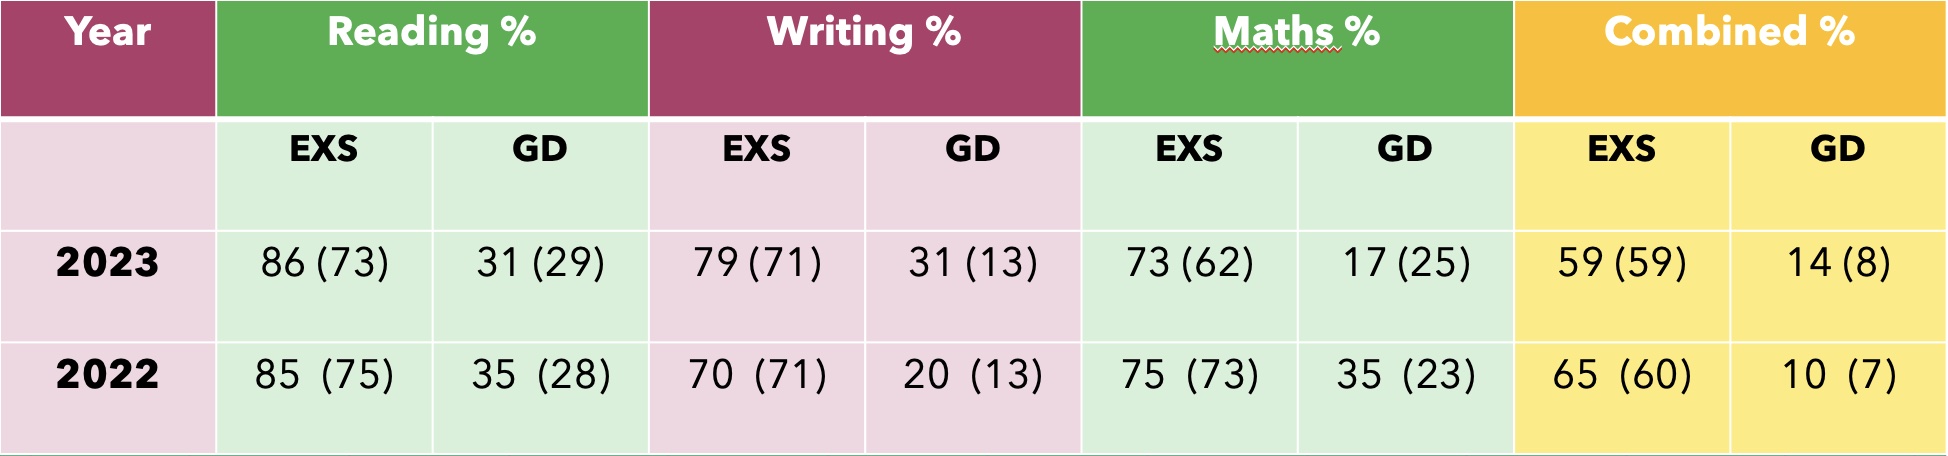
End of Key Stage Two (Year 6 SATs):
% of pupils attaining the expected (EXS) and greater depth (GD) standard in Reading, Writing, Maths and the combined % of children who achieved the standard across all 3 areas. Figures in brackets indicate the national average figures.
2020 & 2021
Due to Covid-19 all national tests were cancelled for 2019-2020 and 2020-2021.
For further school performance data you can visit the Department for Education’s website and study the school performance tables.